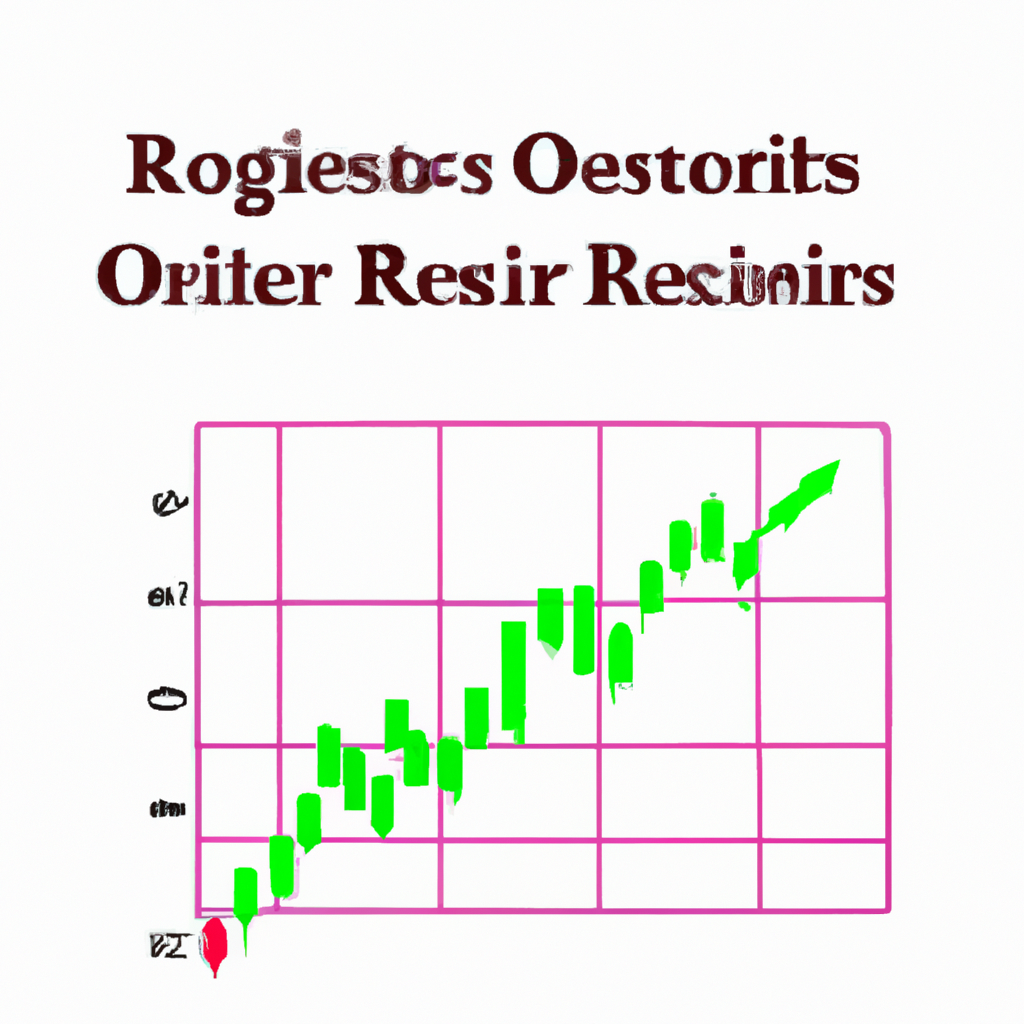
Trend Analysis Using Moving Averages
Introduction
When it comes to analyzing trends in financial markets, moving averages have proven to be a valuable tool for traders and investors. Moving averages help smooth out price data, making it easier to identify trends and potential reversal points. In this article, we will explore the concept of trend analysis using moving averages and how it can be applied in practice.
What is a Moving Average?
A moving average is a calculation that helps identify the average price of a security or asset over a specific period of time. It is called a “moving” average because it continuously updates as new data becomes available, dropping the oldest data point and including the most recent one.
Types of Moving Averages
There are several types of moving averages commonly used in trend analysis:
- Simple Moving Average (SMA): The SMA calculates the average price over a specified period by summing up the prices and dividing by the number of periods. It equally weights all data points within the period.
- Exponential Moving Average (EMA): The EMA gives more weight to recent prices, making it more responsive to recent market movements. It applies a smoothing factor that exponentially decreases the weight of older data points.
- Weighted Moving Average (WMA): The WMA assigns different weights to each data point within the period, giving more importance to recent prices.
Identifying Trends with Moving Averages
Moving averages are commonly used to identify trends in financial markets. By plotting a moving average line on a price chart, traders can easily visualize the overall direction of the market.
Golden Cross and Death Cross: One popular approach is to use two moving averages of different periods, such as the 50-day and 200-day moving averages. When the shorter-term moving average (e.g., 50-day) crosses above the longer-term moving average (e.g., 200-day), it is known as a “golden cross” and is considered a bullish signal. Conversely, when the shorter-term moving average crosses below the longer-term moving average, it is called a “death cross” and is seen as a bearish signal.
Using Moving Averages for Entry and Exit Points
Moving averages can also be used to determine entry and exit points for trades. Traders often look for price crossovers of the moving average line as potential signals to buy or sell.
Support and Resistance: Moving averages can act as support or resistance levels. When the price of an asset approaches a moving average from below and bounces off it, the moving average acts as a support level. Conversely, when the price approaches a moving average from above and gets rejected, it acts as a resistance level.
Conclusion
Moving averages are powerful tools for trend analysis in financial markets. They help traders and investors identify the overall direction of the market and potential entry and exit points. By understanding the different types of moving averages and their applications, individuals can make more informed decisions based on the analysis of trends.
However, it is important to note that moving averages should not be used as standalone indicators and should be combined with other technical analysis tools for more accurate predictions. Additionally, it is recommended to practice and backtest different strategies before implementing them in live trading.


