# Mastering Advanced Candlestick Patterns for Effective Trading
Candlestick patterns are a cornerstone in the technical analysis of financial markets. These patterns offer deep insights into market sentiment and potential price movements, building on the fundamentals of Japanese candlestick charts. In this article, we delve into some advanced candlestick patterns that can significantly enhance your trading strategy.
##
Understanding the Basics of Candlestick Patterns
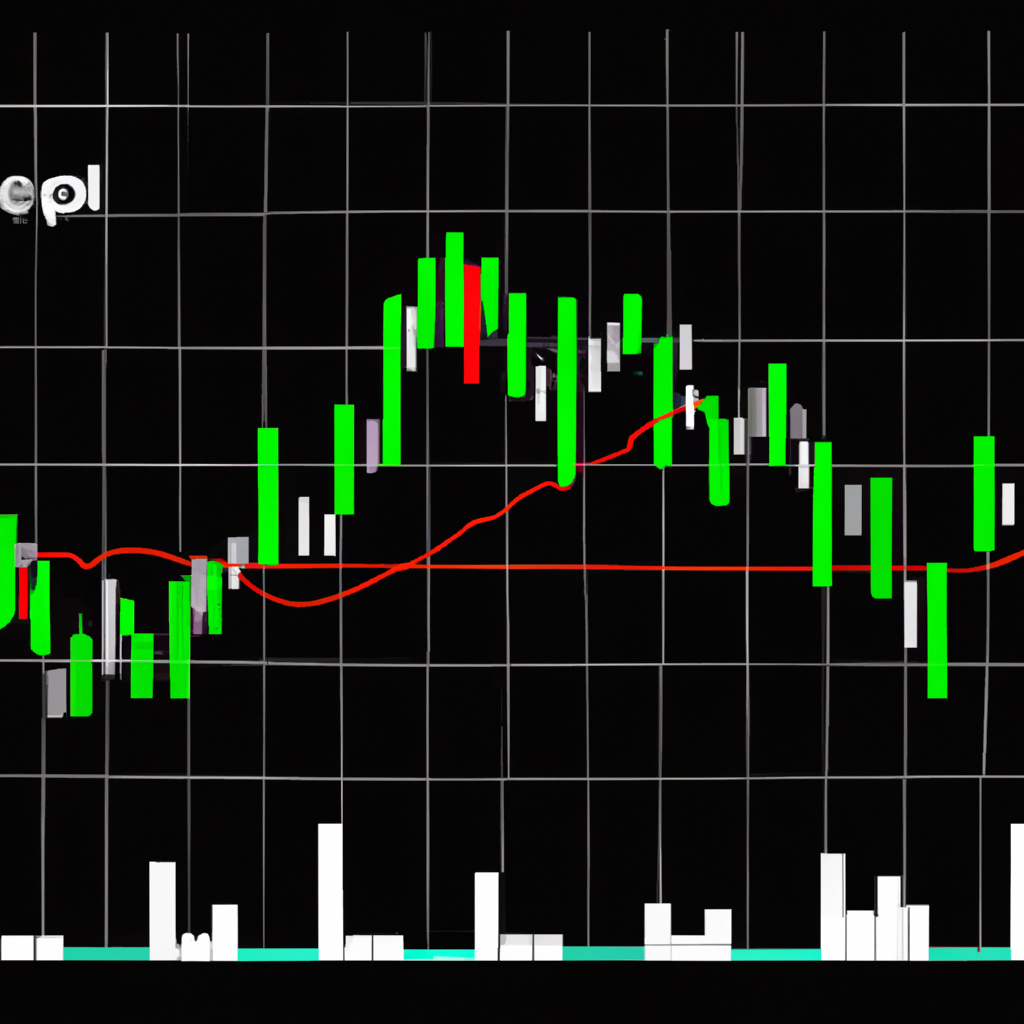
Before exploring the advanced patterns, it’s crucial to grasp the basics of candlestick construction and interpretation. Each candlestick reflects the open, high, low, and close prices of an asset for a specific period. The “body” of the candle shows the open-close range, while “wicks” or “shadows” represent the high and low.
##
Identifying Advanced Candlestick Patterns
Advanced candlestick patterns often involve multiple candles and can indicate a continuation or reversal of the trend. These patterns provide nuanced insights compared to basic single or dual candlestick formations.
###
Bullish Engulfing Pattern
This two-candle pattern appears at the end of a downtrend. The first candle is bearish, followed by a larger bullish candle that completely “engulfs” the body of the first. It signals a potential bullish reversal.
###
Bearish Engulfing Pattern
The bearish engulfing pattern is the inverse of the bullish variant, occurring at the end of an uptrend. The first candle is bullish, followed by a larger bearish candle. This pattern indicates a potential bearish reversal.
###
Three White Soldiers
This bullish pattern comprises three consecutive long-bodied bullish candles at the end of a downtrend, with short or no shadows. Each session opens within the body of the previous candle but closes at a higher level, suggesting a strong bullish momentum.
###
Three Black Crows
Contrary to the Three White Soldiers, the Three Black Crows pattern is bearish. It features three long-bodied, consecutive bearish candles that appear after an uptrend, indicating a shift towards a bearish market.
###
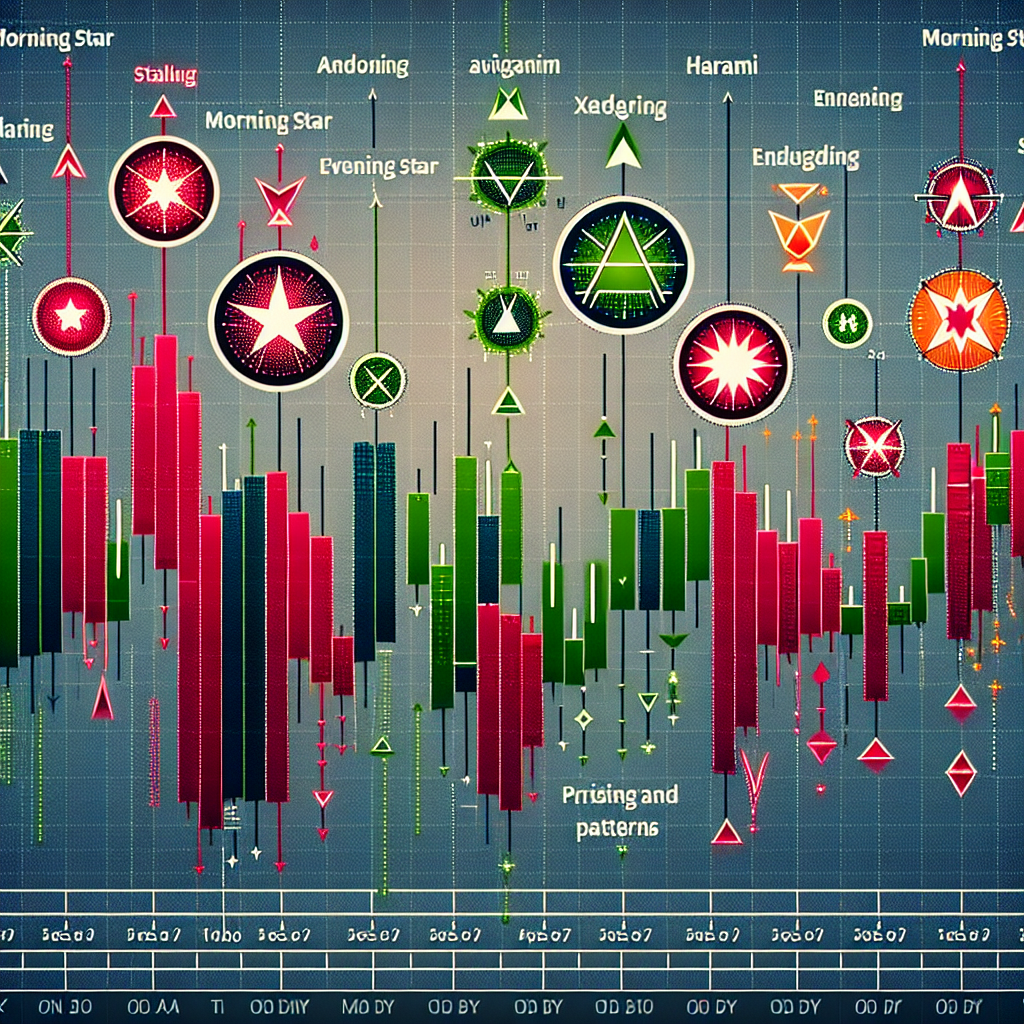
Morning Star and Evening Star Patterns
The Morning Star is a three-candle bullish reversal pattern that involves a large bearish candle, a small-bodied candle or doji that gaps down from the first candle, and a large bullish candle that partially or completely fills the gap. The Evening Star is its bearish counterpart and indicates a reversal from bullish to bearish trend.
###
Piercing Line and Dark Cloud Cover
The Piercing Line is a bullish reversal pattern occurring at the end of a downtrend. It starts with a bearish candle, followed by a bullish candle that opens lower but closes at least halfway up the body of the first candle. The Dark Cloud Cover is the bearish version, occurring after an uptrend.
##
Trading Strategies Based on Advanced Candlestick Patterns
To effectively trade using these patterns, combine them with other technical analysis tools for confirmation. This could include trend lines, moving averages, and volume indicators.
###
Confirmation and Risk Management
Always wait for a pattern to fully form before executing a trade. Using stop-loss orders and setting realistic profit targets are crucial to managing risk. Additionally, consider the market context; patterns that form during periods of high volume carry more weight.
###
Integrating with Technical Indicators
Integrating candlestick patterns with technical indicators such as the Relative Strength Index (RSI) or Moving Average Convergence Divergence (MACD) can enhance the reliability of your trading signals. For instance, a bullish engulfing pattern coupled with an oversold RSI reading may indicate a strong buy signal.
##
Conclusion
Advanced candlestick patterns offer powerful tools for predicting market movements. However, no pattern guarantees success on its own. Combining these patterns with a comprehensive trading plan and continuous learning will improve your trading performance over time. Remember, discipline and patience are key to successful trading based on candlestick patterns.