Introduction to Elliott Wave Analysis Methods
Elliott Wave analysis is a popular technical analysis method used by traders and investors to forecast future price movements in financial markets. It is based on the theory that market prices follow repetitive patterns and can be predicted by analyzing waves of investor psychology.
The Basics of Elliott Wave Theory
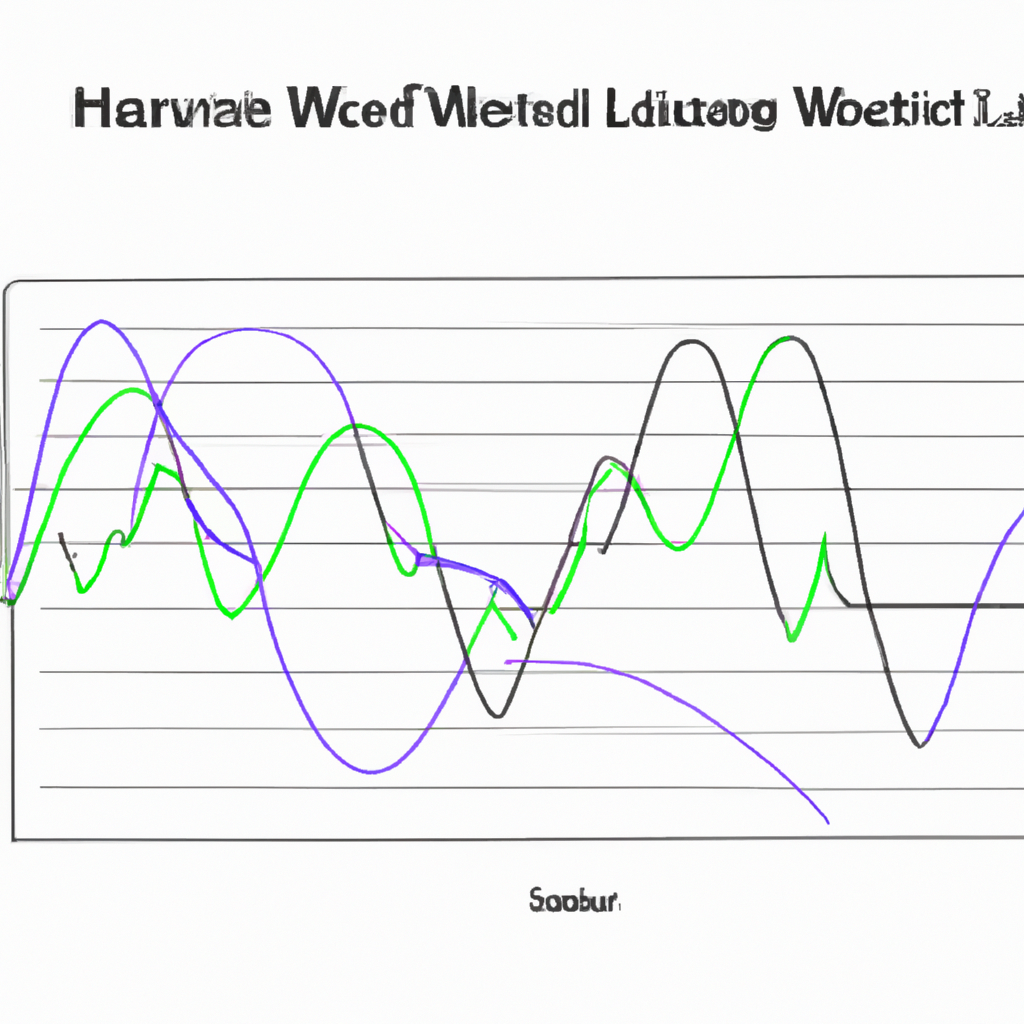
Elliott Wave Theory was developed by Ralph Nelson Elliott in the 1930s. It suggests that market prices move in a series of waves, both up and down, which are driven by the psychology of market participants. These waves can be categorized into two main types: impulse waves and corrective waves.
Impulse waves are the main directional moves in a trend and consist of five smaller waves, labeled as 1, 2, 3, 4, and 5. Waves 1, 3, and 5 move in the direction of the trend, while waves 2 and 4 are counter-trend moves.
Corrective waves, on the other hand, are smaller waves that move against the trend. They consist of three smaller waves, labeled as A, B, and C. Wave A is a counter-trend move, wave B is a partial retracement of wave A, and wave C is the final move in the opposite direction of the trend.
Applying Elliott Wave Analysis
Applying Elliott Wave analysis requires a combination of technical analysis tools and wave counting techniques. Here are the steps involved:
Step 1: Identify the Trend
The first step is to identify the overall trend in the market. This can be done by analyzing price charts and looking for higher highs and higher lows in an uptrend, or lower highs and lower lows in a downtrend.
Step 2: Count the Waves
Once the trend is identified, the next step is to count the waves. Start by identifying the first impulse wave and label it as wave 1. Then, look for the first corrective wave and label it as wave A. Continue this process until all the waves are counted.
Step 3: Determine Wave Relationships
After counting the waves, it is important to determine the relationships between them. According to Elliott Wave theory, certain relationships exist between wave lengths and proportions. For example, wave 3 is often the longest and strongest wave, while wave 2 is usually shorter and retraces less than wave 4.
Step 4: Forecast Future Price Movements
Once the wave count and relationships are determined, traders can use this information to forecast future price movements. By understanding the current position within the wave structure, traders can anticipate where the market is likely to go next and plan their trades accordingly.
Conclusion
Elliott Wave analysis methods provide traders and investors with a systematic approach to understanding market trends and predicting future price movements. While it requires practice and experience to become proficient in wave counting, mastering this technique can greatly enhance trading decisions and improve overall profitability.
It is important to note that Elliott Wave analysis is not foolproof and should be used in conjunction with other technical analysis tools and risk management strategies. However, when used correctly, it can be a valuable tool in the trader’s toolbox.


