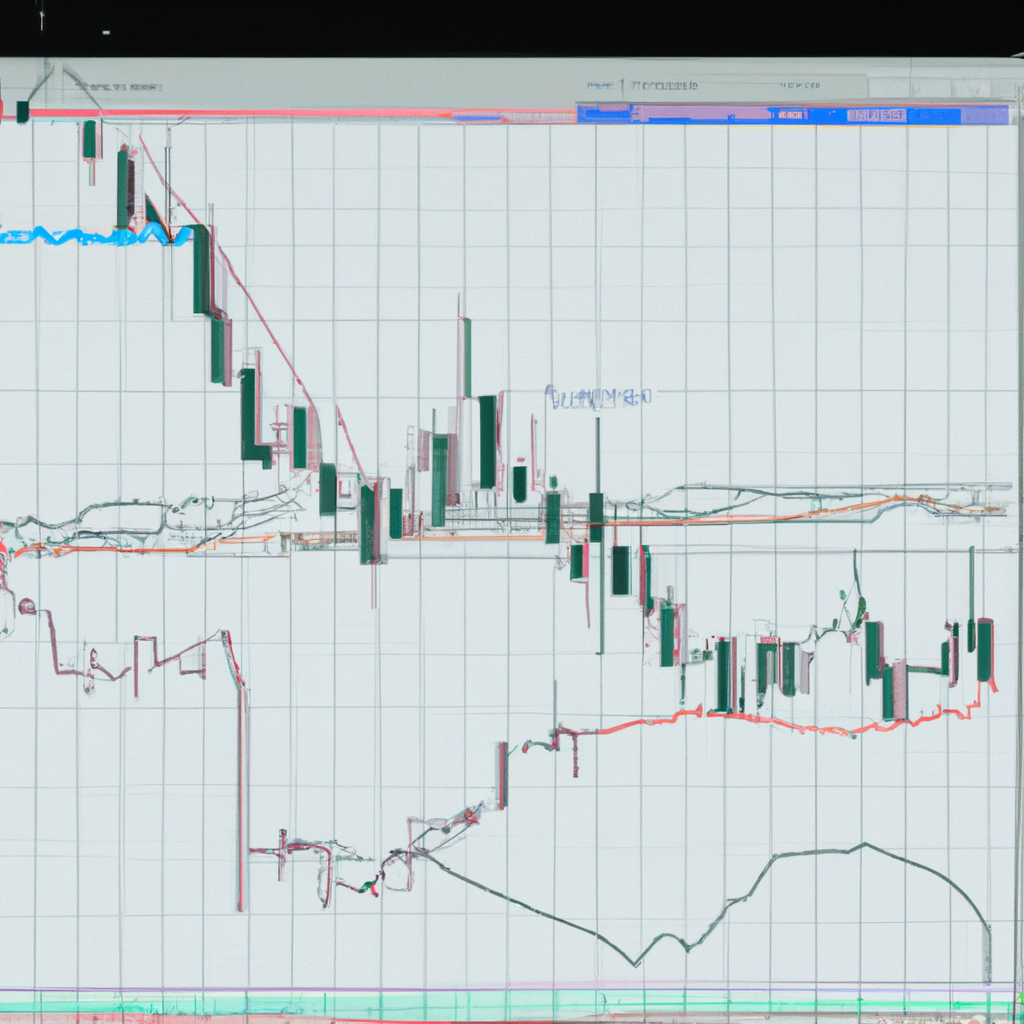
# Trend Analysis Using Moving Averages
In the financial world, understanding market trends is crucial for making informed investment decisions. One of the primary tools used by traders and analysts for trend analysis is the moving average. This article will explore what moving averages are, the different types, how to calculate them, and finally, how they are used in trend analysis.
##
Understanding Moving Averages
A moving average is a statistical method used to analyze data points by creating a series of averages of different subsets of the full data set. It is mainly used in technical analysis to smooth out price data and identify the direction of a market trend. Moving averages are based on past prices and can be categorized into two types: simple moving averages and exponential moving averages.
##
Types of Moving Averages
###
Simple Moving Average (SMA)
The simple moving average is the most basic form of a moving average. It is calculated by adding up the set of numbers (typically closing prices over a specified period) and dividing the sum by the number of data points in the period.
###
Exponential Moving Average (EMA)
The exponential moving average puts more weight on recent data points, making it more responsive to new information. This is particularly useful for traders who need to make quick decisions based on the latest market trends.
##
Calculating Moving Averages
To utilize moving averages in trend analysis, one first needs to know how to calculate them. Here’s a simple step-by-step approach for calculating a simple moving average:
###
Calculating SMA:
1. **Select the Time Period**: Choose the number of periods to include in the average.
2. **Sum the Closing Prices**: Add up the closing prices of the securities for each period.
3. **Divide by the Number of Periods**: Divide the total sum of the closing prices by the number of periods.
Calculating an EMA is a bit more complex due to its weighting system. For this, most traders rely on software or trading platforms that automatically calculate it for them.
##
Using Moving Averages in Trend Analysis
Moving averages can provide valuable insights into market trends. They can help smooth out price data, provide support or resistance levels, and signal when a trend might be reversing.
###
Identifying Market Trends
To determine the direction of a market trend using moving averages, observe the slope of the moving average. If the moving average is rising, the trend is likely up, and if falling, the trend is likely down.
###
Support and Resistance Levels
Moving averages can act as support in a downtrend and resistance in an uptrend, offering opportunities to enter or exit trades.
###
Trend Reversals
A change in the direction of a moving average could signal a trend reversal. For example, when a short-term moving average crosses over a long-term moving average, it may indicate a shift in trend.
##
Conclusion
Moving averages are powerful tools in trend analysis, offering a simplified view of market trends and potential signals for entering or exiting trades. Whether using SMAs or EMAs, these indicators can help demystify market data, allowing for more informed decision-making in trading and investment strategies. As with any analytical tool, it’s essential to use moving averages as part of a broader analysis strategy to make the most informed decisions.


