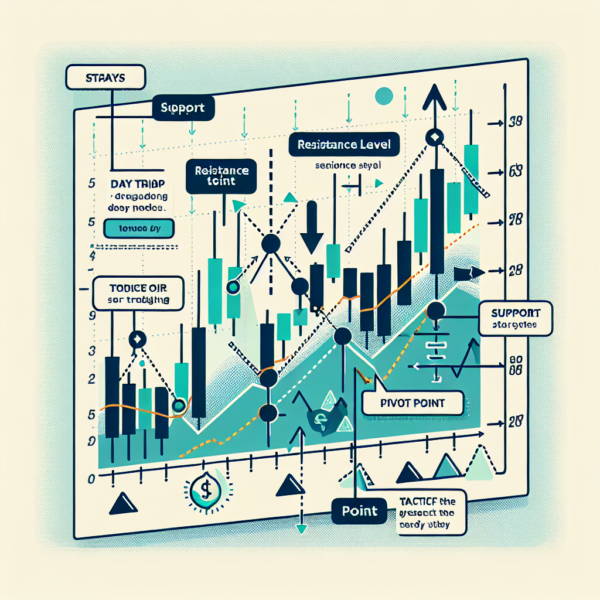
Mastering Pivot Points for Effective Day Trading

Introduction to Pivot Points in Day Trading
Pivot points are widely used among day traders to determine potential support and resistance levels, essentially predicting the direction of short-term market movements. By calculating these points, traders get an insight into where the market may turn or continue on its path, providing opportunities for entry and exit positions. Understanding and using pivot points can give day traders a structured way to look at intraday price movements.
What Are Pivot Points?
At their core, pivot points are a type of technical indicator derived through a simple calculation involving the high, low, and close prices from the previous trading day. This calculation produces the pivot point (PP) itself, which acts as the primary support and resistance level. Additional levels can be calculated to provide further insight: these are known as S1, S2, S3 (support levels), and R1, R2, R3 (resistance levels).
Calculating Pivot Points
Standard Pivot Point Calculation
The basic formula to calculate the pivot point is:
[PP = frac{(High_{previous} + Low_{previous} + Close_{previous})}{3}]
From this, further support and resistance levels are derived:
[R1 = (2 times PP) – Low_{previous}]
[S1 = (2 times PP) – High_{previous}]
[R2 = PP + (High_{previous} – Low_{previous})]
[S2 = PP – (High_{previous} – Low_{previous})]
There are variations to these formulas, including additional calculations that account for more support and resistance levels (S3 and R3), and alternative methods like the Fibonacci and Woodie’s pivot points, each with its unique formula.
Implementing Pivot Points in Day Trading
Identifying Potential Support and Resistance
Once you’ve calculated or have access to the day’s pivot points through your trading platform, observe price action relative to these levels. The pivot point is the primary level to watch; prices moving above it indicate bullish sentiment, while movement below suggests bearish sentiment. R1, R2, and R3 represent progressively stronger resistance levels on upward movements. Conversely, S1, S2, and S3 represent support levels on downward trends.
Setting Entry and Exit Points
Traders often use pivot points to set entry and exit points for trades. A common strategy is to buy when the price moves above a pivot point or one of the resistance levels with a stop loss just below the pivot point or support level. Alternatively, selling short when the price falls below a pivot point or support level with a stop loss just above the pivot point or resistance level can be a strategy. The R1 and S1 levels typically provide the primary trading range, with R2, S2, R3, and S3 offering wider targets or stop-loss points.
Combining Pivot Points with Other Indicators
For enhanced accuracy, many traders combine pivot points with other forms of technical analysis. This can include moving averages to determine the trend, RSI (Relative Strength Index) to gauge overbought or oversold conditions, or MACD (Moving Average Convergence Divergence) for confirming momentum. Using these tools in conjunction with pivot points can provide a more comprehensive view of the market, helping to improve the decision-making process.
Conclusion
Pivot points offer a straightforward yet powerful tool for day traders seeking to capitalize on short-term market movements. By identifying potential support and resistance levels, traders can make more informed decisions regarding entry and exit points. However, like all trading strategies, it’s essential to incorporate risk management practices and consider complementing pivot points with other technical analysis tools to enhance trading outcomes. Remember, no indicator provides a guarantee—thorough analysis and a clear trading plan are the foundations of successful day trading.