# Understanding Volume Spikes and Market Reversals
In the dynamic world of stock trading, two phenomena that draw significant attention from investors are volume spikes and market reversals. These events can indicate shifts in market sentiment, offering potential opportunities or signaling impending risks. This article delves into both phenomena, exploring their implications and how investors can interpret them.
##
What are Volume Spikes?
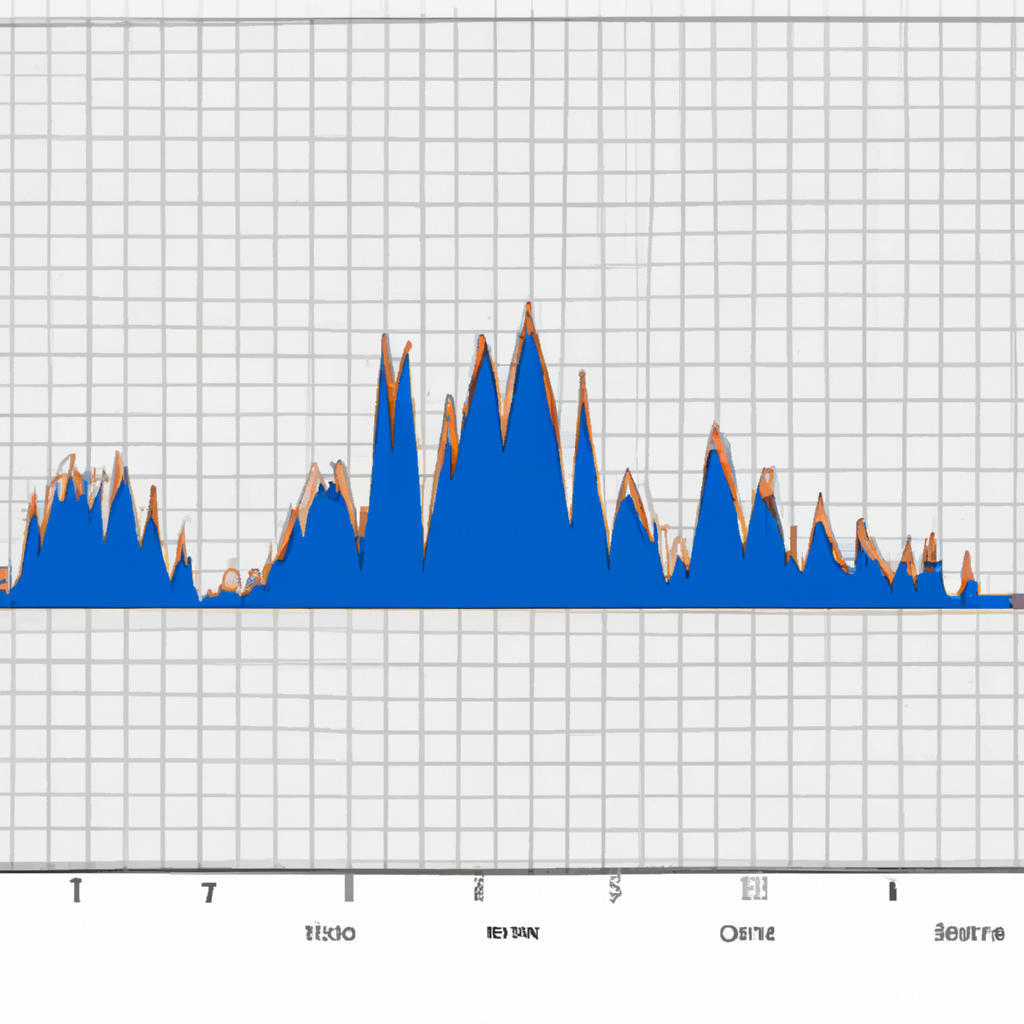
Volume spikes occur when the trading volume of a stock significantly exceeds its average trading volume over a specific period. This sudden increase can be attributed to numerous factors, including earnings reports, news events, or major shifts in market sentiment. Volume spikes are noteworthy because they suggest a heightened interest in the stock, which can precede significant price movements.
###
Implications of Volume Spikes
Volume spikes can have varying implications, depending on their context. A spike accompanied by a price surge may indicate strong buying pressure, suggesting bullish sentiment among investors. Conversely, a volume spike alongside a price drop could signify selling pressure, potentially indicating bearish sentiment. Understanding the context and potential catalysts behind the spike is crucial for accurate interpretation.
##
What are Market Reversals?
Market reversals refer to when the overall trend of a stock or the broader market shifts direction, moving from an uptrend to a downtrend, or vice versa. Identifying potential market reversals is key for investors looking to maximize their gains or minimize losses. These reversals often occur following significant news events, changes in economic indicators, or shifts in investor sentiment.
###
Signals of Market Reversals
Several technical indicators can help identify potential market reversals:
– **Trend reversal patterns**: Patterns such as head and shoulders, double tops and bottoms, and others can signal reversal possibilities.
– **Moving averages**: Crossovers of short-term and long-term moving averages can indicate shifts in momentum.
– **Momentum indicators**: Tools like the Relative Strength Index (RSI) or the Moving Average Convergence Divergence (MACD) can signal when a stock is overbought or oversold, potentially leading to a reversal.
##
Interpreting Volume Spikes in the Context of Market Reversals
Volume spikes can serve as early indicators of market reversals. An increase in volume following a prolonged uptrend could indicate a peak as investors start taking profits, leading to a potential reversal. Conversely, a spike in volume during a downtrend may suggest that a bottom is forming, as selling pressure exhausts and buyers begin to step in.
###
Strategies for Trading Volume Spikes and Market Reversals
– **Wait for confirmation**: Look for additional signs that support the reversal signal before making a trade.
– **Set stop-loss orders**: Protect against false signals by setting stop-loss orders at strategic levels.
– **Monitor related markets**: Sometimes, a spike or reversal in one market can presage similar movements in correlated markets or stocks.
##
Conclusion
Volume spikes and market reversals are critical phenomena that can offer strategic trading opportunities. By learning to interpret these events in the context of broader market conditions, investors can significantly improve their trading strategy. However, it’s essential to approach these signals with care, combining them with other indicators and sound risk management practices to make informed decisions in the ever-changing landscape of the stock market.