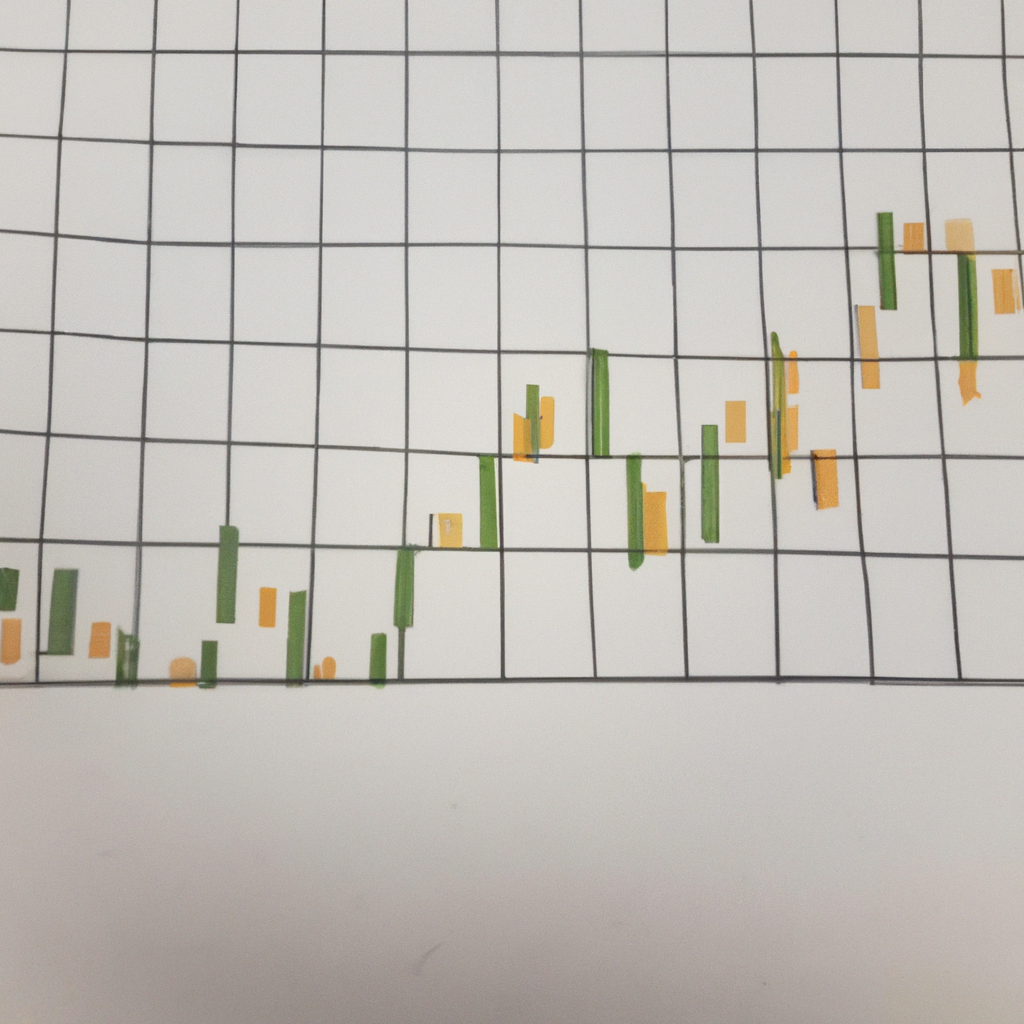
Identifying Key Support and Resistance Zones Support and resistance zones are essential tools for technical analysis in the financial markets. These zones represent levels at which the price of an asset tends to find support as it falls or encounters resistance as it rises. By identifying these key levels, traders…
Category: Technical Analysis

Unlocking the Secrets of Chart Patterns: A Guide to Identifying Common Patterns
Identifying Common Chart Patterns Introduction Chart patterns are visual representations of price movements in financial markets. By analyzing these patterns, traders and investors can gain insights into potential future price movements and make more informed trading decisions. In this article, we will explore some of the most common chart patterns…

Mastering the Art of Identifying Reliable Support Levels
Finding Reliable Support Levels Introduction Support levels are crucial for traders and investors in the financial markets. They represent price levels at which an asset tends to find buying interest and experiences a bounce back after a decline. Identifying reliable support levels is essential for making informed trading decisions and…

Mastering the Art of Drawing Accurate Trend Lines
Drawing Accurate Trend Lines Trend lines are an essential tool in technical analysis, helping traders and investors identify the direction and strength of a market trend. Drawing accurate trend lines is crucial for making informed decisions and maximizing profits. In this article, we will explore the steps to draw precise…

Sentiment Analysis: Enhancing Technical Trading Strategies
Sentiment Analysis in Technical Trading Introduction Sentiment analysis is a powerful tool that has gained significant popularity in the field of technical trading. It involves the use of natural language processing (NLP) and machine learning techniques to analyze and interpret the emotions, opinions, and attitudes expressed in textual data. By…

Mastering Price Action Trading Techniques: Reading Price Charts for Profitability
Price Action Trading Techniques: Mastering the Art of Reading Price Charts Introduction Price action trading is a popular approach among traders that focuses on analyzing pure price movement on a chart, rather than relying on indicators or complex mathematical formulas. By studying price patterns, candlestick formations, and support and resistance…

Using Pivot Points for Successful Day Trading
Using Pivot Points for Day Trading Introduction Pivot points are widely used by day traders to identify potential support and resistance levels in financial markets. These levels can provide valuable insights into market sentiment and help traders make informed trading decisions. In this article, we will explore how to effectively…

Algorithmic Trading: Enhancing Strategies with Technical Indicators
Algorithmic Trading with Technical Indicators Introduction Algorithmic trading has become increasingly popular in the financial markets, allowing traders to execute trades automatically based on predefined rules and conditions. One of the key components of algorithmic trading is the use of technical indicators, which are mathematical calculations applied to historical price…

Mastering Volume Analysis Techniques: A Comprehensive Guide
Volume Analysis Techniques: A Comprehensive Guide Introduction Volume analysis is a powerful tool used by traders and investors to gain insights into market trends and make informed decisions. By analyzing the trading volume of a security or market, traders can identify potential price reversals, confirm trends, and spot market manipulation….

Algorithmic Strategies: Enhancing Technical Analysis in Financial Markets
Algorithmic Strategies in Technical Analysis Introduction Technical analysis is a widely used approach in financial markets to predict future price movements based on historical data. Traditionally, technical analysis involved manual analysis of charts and patterns. However, with advancements in technology, algorithmic strategies have gained popularity in recent years. In this…
