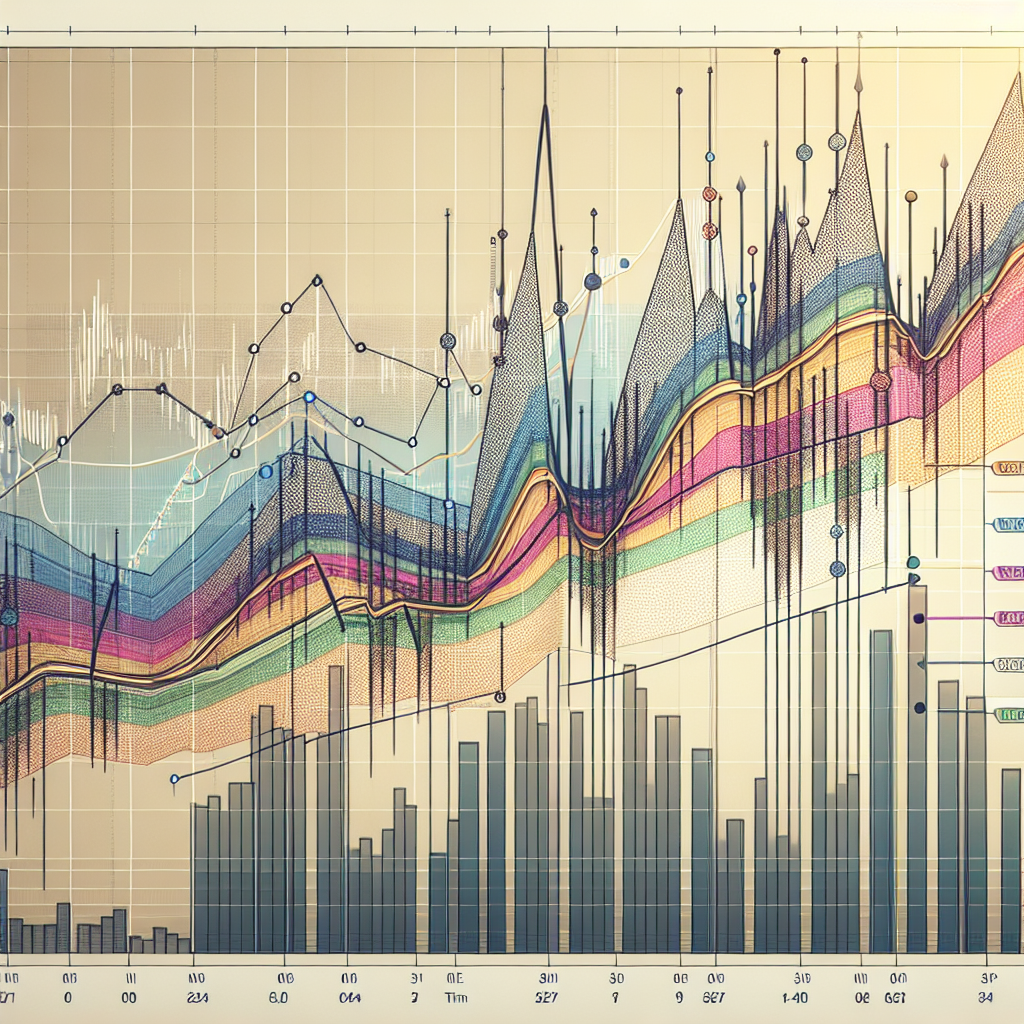
# Understanding Volume Spikes and Market Reversals In the dynamic world of stock trading, two phenomena that draw significant attention from investors are volume spikes and market reversals. These events can indicate shifts in market sentiment, offering potential opportunities or signaling impending risks. This article delves into both phenomena, exploring…
Category: Technical Analysis

Mastering Overbought & Oversold Market Conditions
# Analyzing Overbought and Oversold Conditions In the dynamic world of stock trading and investment, understanding market conditions is crucial for making informed decisions. Particularly, the concepts of “overbought” and “oversold” conditions offer valuable insights into potential market movements. This article delves into these concepts, discussing how to identify and…

Mastering RSI Strategies for Effective Market Analysis
Introduction to RSI in Market Analysis The Relative Strength Index (RSI) is a momentum oscillator that measures the speed and change of price movements. Developed by J. Welles Wilder in 1978, RSI has become one of the most widely used technical indicators for traders and investors aiming to identify overbought…

Mastering Sentiment Indicators for Market Insights
Understanding Sentiment Indicators for Market Predictions Sentiment indicators are invaluable tools for investors looking to gauge the market’s mood. They offer insights into the emotional and psychological state of market participants, helping to predict the direction of financial markets with greater accuracy. By understanding the sentiment indicators, investors can make…

Mastering Trend Analysis with Moving Averages
Using Moving Averages for Trend Analysis Moving averages are a cornerstone of financial analysis, offering insights into market trends and helping traders and analysts predict future movements. This tool smooths price data to create a single flowing line, making it easier to identify the direction of a trend, be it…

Unlocking Advanced Candlestick Patterns for Trading Success
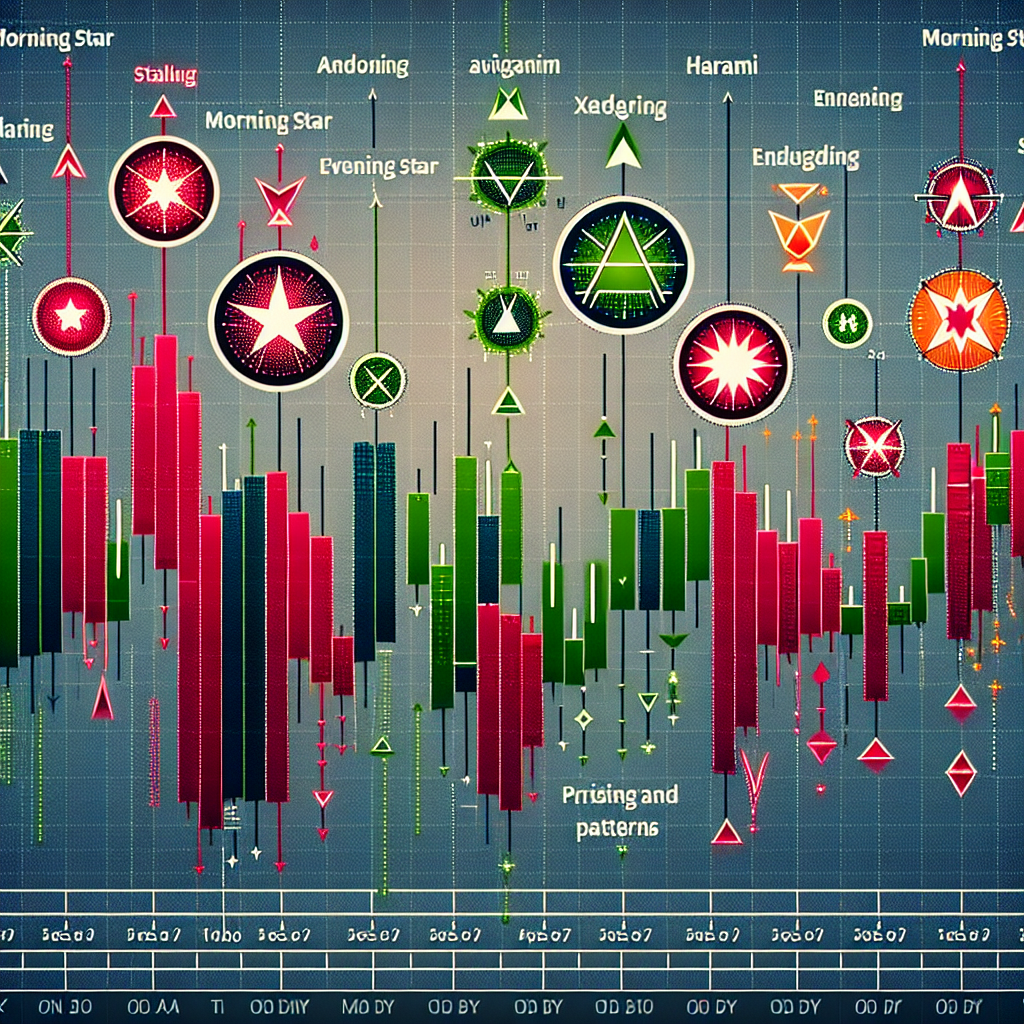
# Mastering Advanced Candlestick Patterns for Effective Trading Candlestick patterns are a cornerstone in the technical analysis of financial markets. These patterns offer deep insights into market sentiment and potential price movements, building on the fundamentals of Japanese candlestick charts. In this article, we delve into some advanced candlestick patterns…

Trend Analysis with Moving Averages Simplified
# Trend Analysis Using Moving Averages In the financial world, understanding market trends is crucial for making informed investment decisions. One of the primary tools used by traders and analysts for trend analysis is the moving average. This article will explore what moving averages are, the different types, how to…

A Complete Guide to the Bollinger Band Squeeze
Understanding the Bollinger Band Squeeze Technique The Bollinger Band squeeze technique is an influential strategy that traders across the globe use to identify potential market breakouts. Originating from the Bollinger Bands indicator, invented by John Bollinger in the 1980s, this technique is crucial for spotting periods of low volatility in…

A Comprehensive Guide to Understanding Market Cycles
Introduction to Market Cycles Understanding market cycles is crucial for investors, economists, and business owners alike. Market cycles refer to the long-term pattern of peaks and troughs in the financial markets. These cycles are reflective of the underlying economic conditions, investor sentiment, and external factors influencing the markets. Recognizing and…

Mastering Trade Signals with MACD: A Comprehensive Guide
Introduction to MACD The Moving Average Convergence Divergence (MACD) is a trend-following momentum indicator that reveals the relationship between two moving averages of a security’s price. Developed by Gerald Appel in the late 1970s, MACD is one of the simplest and most effective momentum indicators available. The MACD turns two…
