Algorithmic Trading with Technical Indicators
Introduction
Algorithmic trading has become increasingly popular in the financial markets, allowing traders to execute trades automatically based on predefined rules and conditions. One of the key components of algorithmic trading is the use of technical indicators, which are mathematical calculations applied to historical price and volume data to identify potential trading opportunities. In this article, we will explore the concept of algorithmic trading with technical indicators and discuss how they can be effectively utilized.
Understanding Technical Indicators
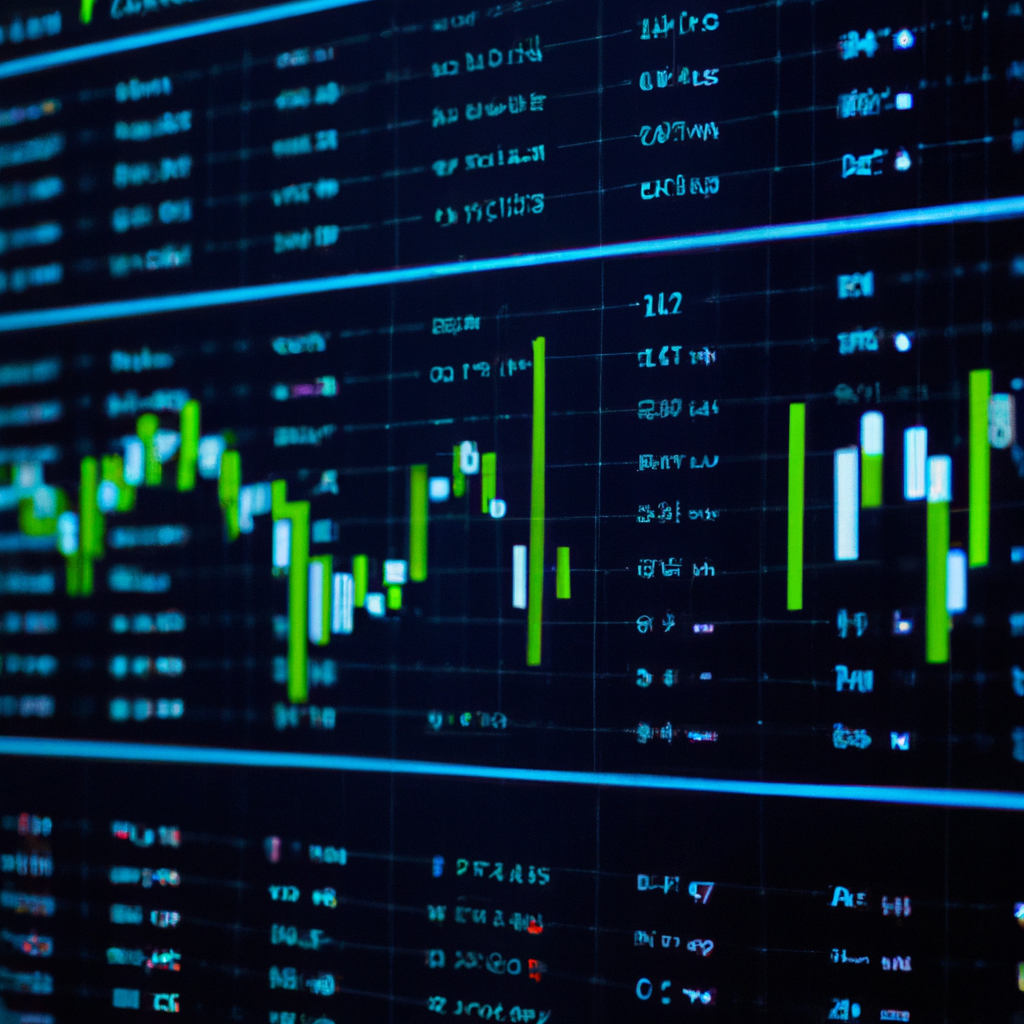
Technical indicators are tools that help traders analyze historical price and volume data to identify patterns and trends in the market. These indicators are based on mathematical formulas and calculations and are typically displayed as lines or histograms on price charts. Some commonly used technical indicators include moving averages, relative strength index (RSI), stochastic oscillator, and Bollinger Bands.
Benefits of Algorithmic Trading with Technical Indicators
Algorithmic trading with technical indicators offers several advantages over manual trading. Here are some key benefits:
1. Elimination of Emotions: Algorithmic trading removes the emotional aspect of trading, as trades are executed automatically based on predefined rules. This helps traders avoid impulsive and irrational decisions driven by fear or greed.
2. Increased Speed and Efficiency: Algorithms can analyze vast amounts of data and execute trades within milliseconds, which is not possible for human traders. This speed and efficiency can lead to better trade execution and improved profitability.
3. Backtesting and Optimization: Algorithmic trading allows traders to backtest their strategies using historical data to evaluate their performance. This enables traders to fine-tune their strategies and optimize them for better results.
Steps to Implement Algorithmic Trading with Technical Indicators
Here are the steps involved in implementing algorithmic trading with technical indicators:
1. Define Trading Strategy: Determine the rules and conditions that will trigger trade signals. For example, a simple strategy could be to buy when the 50-day moving average crosses above the 200-day moving average.
2. Choose Technical Indicators: Select the technical indicators that align with your trading strategy. Consider factors such as trend identification, momentum, and overbought/oversold conditions.
3. Obtain Historical Data: Acquire historical price and volume data for the desired trading instruments. This data will be used for backtesting and optimizing your strategy.
4. Develop Algorithmic Trading System: Use programming languages such as Python or R to develop your algorithmic trading system. This system should incorporate the defined trading strategy and technical indicators.
5. Backtest and Optimize: Test your algorithmic trading system using historical data to evaluate its performance. Make necessary adjustments to optimize the strategy for better results.
6. Implement Live Trading: Once you are satisfied with the performance of your algorithmic trading system, connect it to a brokerage platform or an API to execute trades automatically in real-time.
Conclusion
Algorithmic trading with technical indicators has revolutionized the way traders operate in the financial markets. By leveraging the power of mathematical calculations and historical data, traders can automate their trading strategies, eliminate emotions, and improve efficiency. However, it is important to remember that algorithmic trading is not foolproof and requires continuous monitoring and adjustment to adapt to changing market conditions.


