Introduction to Fibonacci Retracement
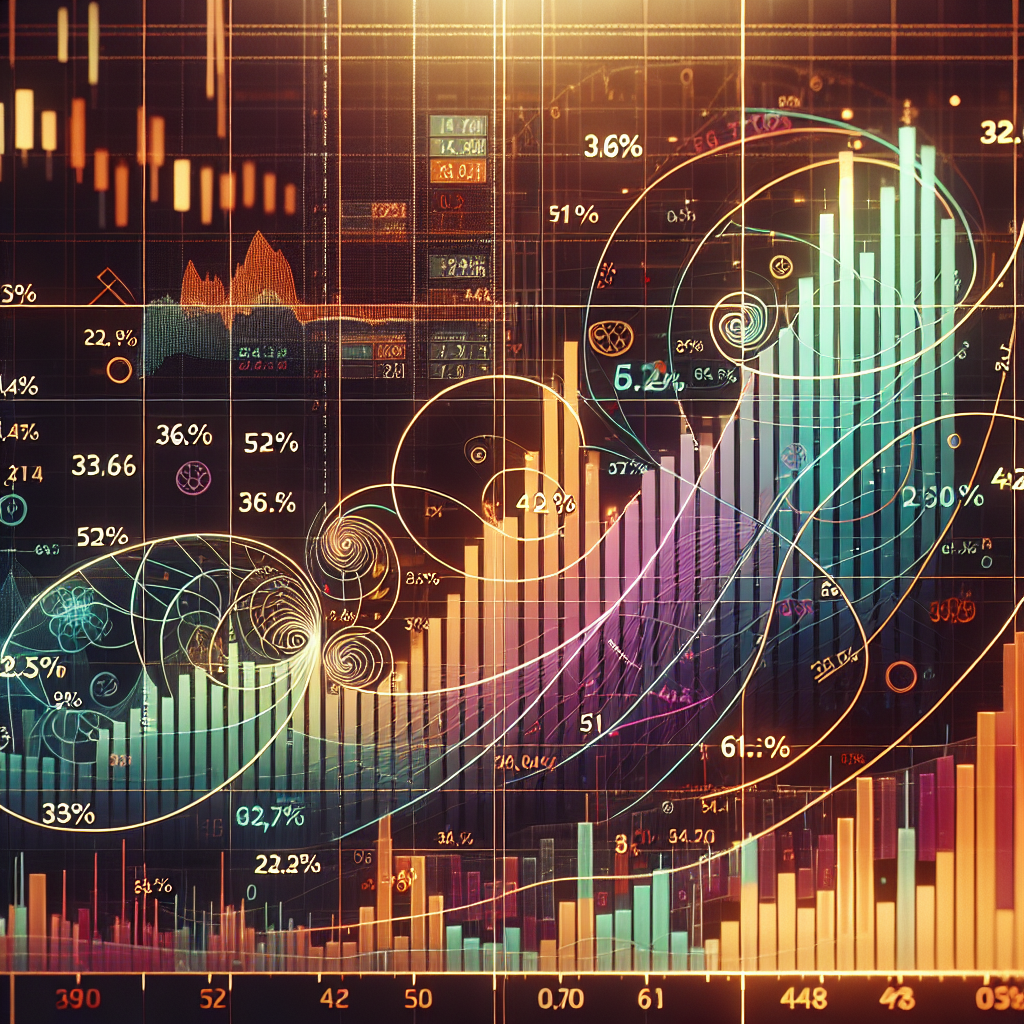
Fibonacci retracement is a popular technical analysis tool used by traders to predict future levels of support and resistance in financial markets. This method is based on the idea that markets will retrace a predictable portion of a move, after which they will continue to move in the original direction. The concept derives from the Fibonacci sequence, a set of numbers starting with zero and one, with each subsequent number being the sum of the previous two. The key Fibonacci ratios used in trading are 23.6%, 38.2%, 50%, 61.8%, and sometimes 76.4%, derived from mathematical relationships within the sequence.
Applications of Fibonacci Retracement
Fibonacci retracements are versatile tools that can be applied in various trading strategies and markets, including stocks, commodities, and foreign exchange. Here are some of the primary applications:
Identifying Support and Resistance Levels
One of the main uses of Fibonacci retracement is to identify potential support and resistance levels. These are price levels where a security is expected to stop falling or rising, respectively, and possibly reverse direction. By drawing Fibonacci lines between significant price points, such as a high and a low, traders can anticipate where these levels might occur.
Setting Stop-Loss Orders
Traders often use Fibonacci levels to set stop-loss orders. This strategy involves placing an order to sell a security when it reaches a certain price level. By aligning these orders with Fibonacci retracement levels, traders aim to minimize potential losses by exiting a position near a support level, hoping the price will bounce back.
Profit Target Setting
Similarly, Fibonacci retracements can help in setting profit targets by identifying potential points of resistance where a price movement might stall or reverse. Traders might set their targets just below these levels to ensure a higher probability of exiting a trade profitably before the market potentially turns against their position.
Timing Entry and Exit Points
By analyzing the behavior of an asset’s price around Fibonacci levels, traders can make more informed decisions about when to enter or exit a trade. A common strategy is to look for confirmation signals such as candlestick patterns or indicators when the price approaches a Fibonacci level, indicating that it might be a good time to make a move.
Combining Fibonacci Retracement with Other Indicators
For increased effectiveness, Fibonacci retracement is often used in conjunction with other forms of technical analysis. Here are a few examples:
With Moving Averages
Combining Fibonacci retracement levels with moving averages can help traders identify more robust support and resistance levels. If a Fibonacci retracement level coincides with a significant moving average (like the 50-day or 200-day), it may serve as a stronger signal of potential market movements.
With Oscillators and Momentum Indicators
Using oscillators (like the Relative Strength Index) and momentum indicators (like the MACD) in tandem with Fibonacci retracements can help validate reversal signals. For instance, if the price reaches a key Fibonacci level and an oscillator indicates the asset is overbought or oversold, it could reinforce the likelihood of a price reversal.
Conclusion
Fibonacci retracement is a powerful tool in the arsenal of technical traders, providing valuable insights into potential future movements of prices in the financial markets. While it is not without its critics and is best used in conjunction with other indicators, many traders find Fibonacci retracement an indispensable part of their trading strategy. Understanding its applications and how to combine it with other analytical tools can significantly enhance a trader’s ability to predict market movements and make profitable trades.