Introduction to Finding Reliable Support Levels
Finding reliable support levels is crucial for traders and investors looking to maximize their profits and minimize risks. Support levels, the price point at which a security tends to stop falling because of the emergence of demand, are pivotal in making informed decisions about entry and exit points in the market. This article offers a comprehensive guide on identifying these critical levels, providing you with a foundational tool for your trading or investing toolkit.
Understanding Support Levels
Before diving into the methodology of finding reliable support levels, it’s essential to understand what they represent. Support levels are essentially psychological milestones in the trading world where market participants believe the asset is undervalued, leading to increased buying and, consequently, a decrease in supply. Identifying these levels accurately can lend traders a significant advantage in predicting market movements.
Step-by-Step Guide to Finding Reliable Support Levels
Step 1: Start with the Basics – Use Historical Data
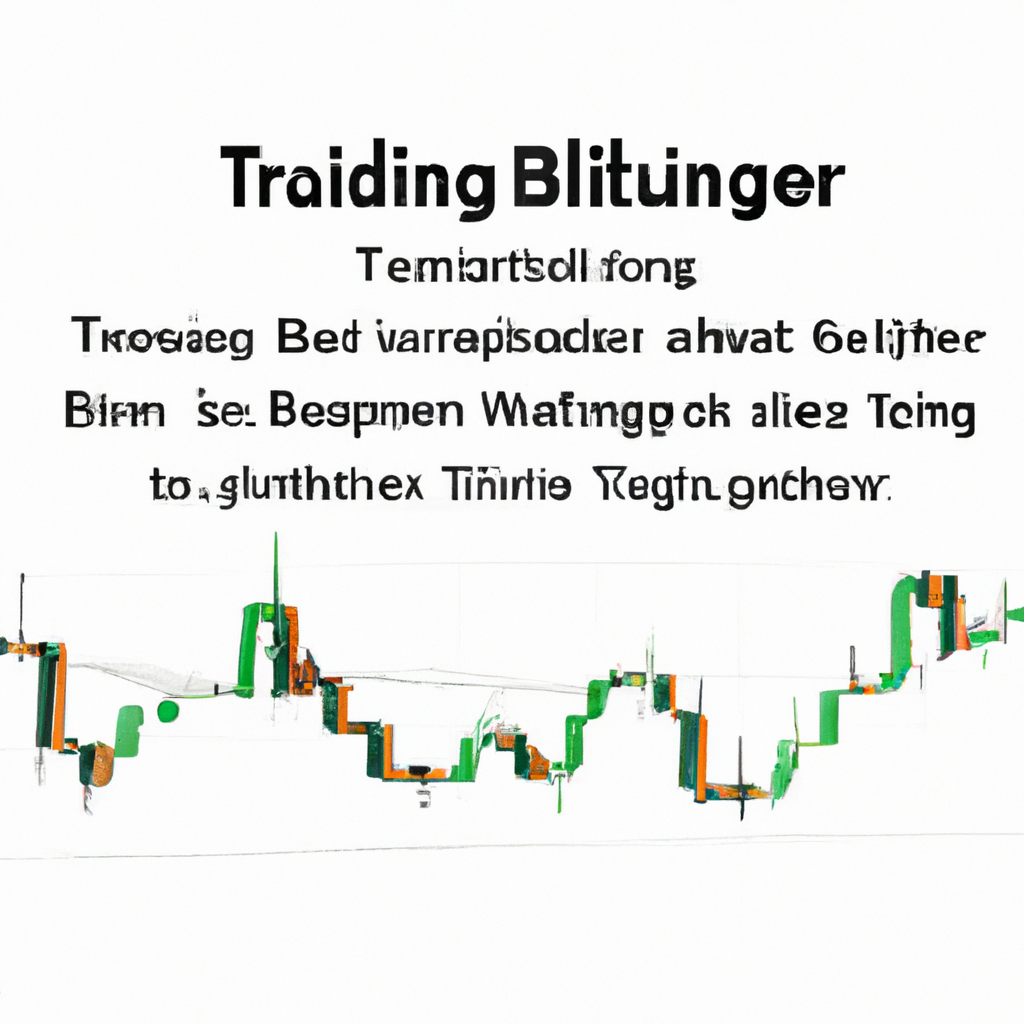
Browsing through historical price charts is the first step in identifying support levels. Look for patterns where the price has stopped declining and has shown a tendency to bounce back. These areas often indicate strong support levels. It’s crucial to observe these patterns across different time frames to ensure consistency and reliability.
Step 2: Incorporate Volume Into Your Analysis
Volume plays a significant role in validating support levels. A genuine support level is often accompanied by an increase in trading volume, signifying a higher interest in the asset at that price point. Analyzing volume patterns in conjunction with price movements provides a more robust framework for identifying reliable support levels.
Step 3: Apply Technical Indicators
Technical indicators such as moving averages, Relative Strength Index (RSI), and Fibonacci retracement levels can be effective tools in identifying potential support zones. For instance, a moving average can act as dynamic support, changing over time with the price action. Combining these indicators with historical price analysis enhances the probability of pinpointing strong support levels.
Step 4: Look for Rounded Bottoms in Price Charts
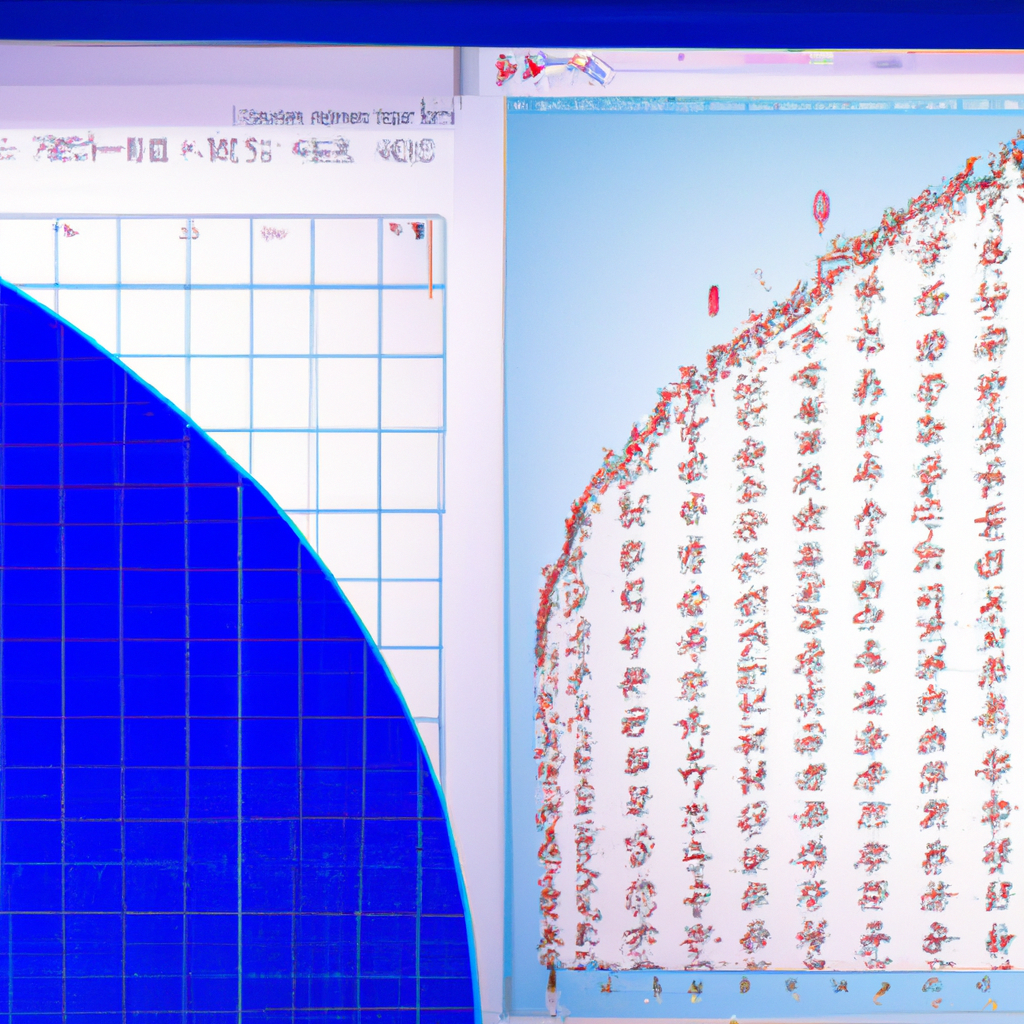
Rounded bottoms, or “U-shaped” recoveries, often signify strong support areas. These patterns suggest a gradual shift in market sentiment from bearish to bullish. Identifying these formations early can help traders capitalize on the early stages of a market reversal.
Step 5: Consider the Role of Psychological Price Levels
Psychological price levels, such as round numbers or historically significant prices, often serve as informal support levels due to the human tendency to gravitate towards these figures. Incorporating these into your analysis adds another layer to finding robust support points.
Combining Techniques for Enhanced Accuracy
While each of the aforementioned steps offers a method to identify support levels, combining them enhances the accuracy and reliability of your findings. Cross-verifying support levels through multiple approaches—technical, psychological, and volume-based analyses—provides a comprehensive view, helping traders make more informed decisions. Always remember, the more evidence you have to support the existence of a support level, the more likely it is to hold.
Conclusion
Finding reliable support levels requires patience, practice, and a holistic approach to market analysis. By starting with historical data, incorporating volume, applying technical indicators, recognizing psychological price levels, and looking for rounded bottoms in price action, traders can significantly improve their ability to pinpoint strong support levels. Remember, the goal is to use these levels as one component of a broader, well-considered trading strategy. As with any trading approach, it’s crucial to accompany these techniques with sound risk management practices.


